What is XYZ Analysis
- XYZ Analysis is an inventory categorisation technique based on the demand variations overtime, the demand variations may caused by different factors such as seasonality, competitor action, or any events happen in a specific period.
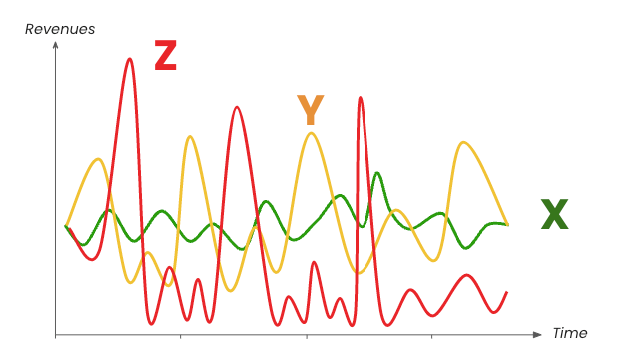
- XYZ Analysis divides an inventory into three categories
- “X items” – Stable, consistent demand, easy to forecast
- “Y items” – Fluctating demand
- “Z items” – Irregular demand, high uncertainty
How to use XYZ Analysis
- Classify products/customer/problems based on their fluctation over time
- Better prioritise time, focus, investment to each uncertainty product
How to do
- Get the products data
- Calculate the mean or average of revenue for each product.
- Calculate the standard diviation of revenue for each product
- Calculate the coefficient of variation by (average divided by standard diviation)
- Classify into 3 groups
- "X" group for the product that has coefficient of variation from 0% to 50%
- "Y" group for the product that has coefficient of variation from 50% to 100%
- "Z" group for the product that has coefficient of variation more than 100%
Classification percentage can be change based on your use-cases.