We can use Matplotlib Dates API together with major and minor tick formatter.
Preparing data
import pandas as pd
import numpy as np
import seaborn as sns


random_value = np.random.rand(365, 1)
df = pd.DataFrame(random_value, columns=['Value'])
Vanila Plot

g = sns.lineplot(x=df.index, y='Value', data=df, color=default_color)
plt.show()
Re-index and filled in with 0
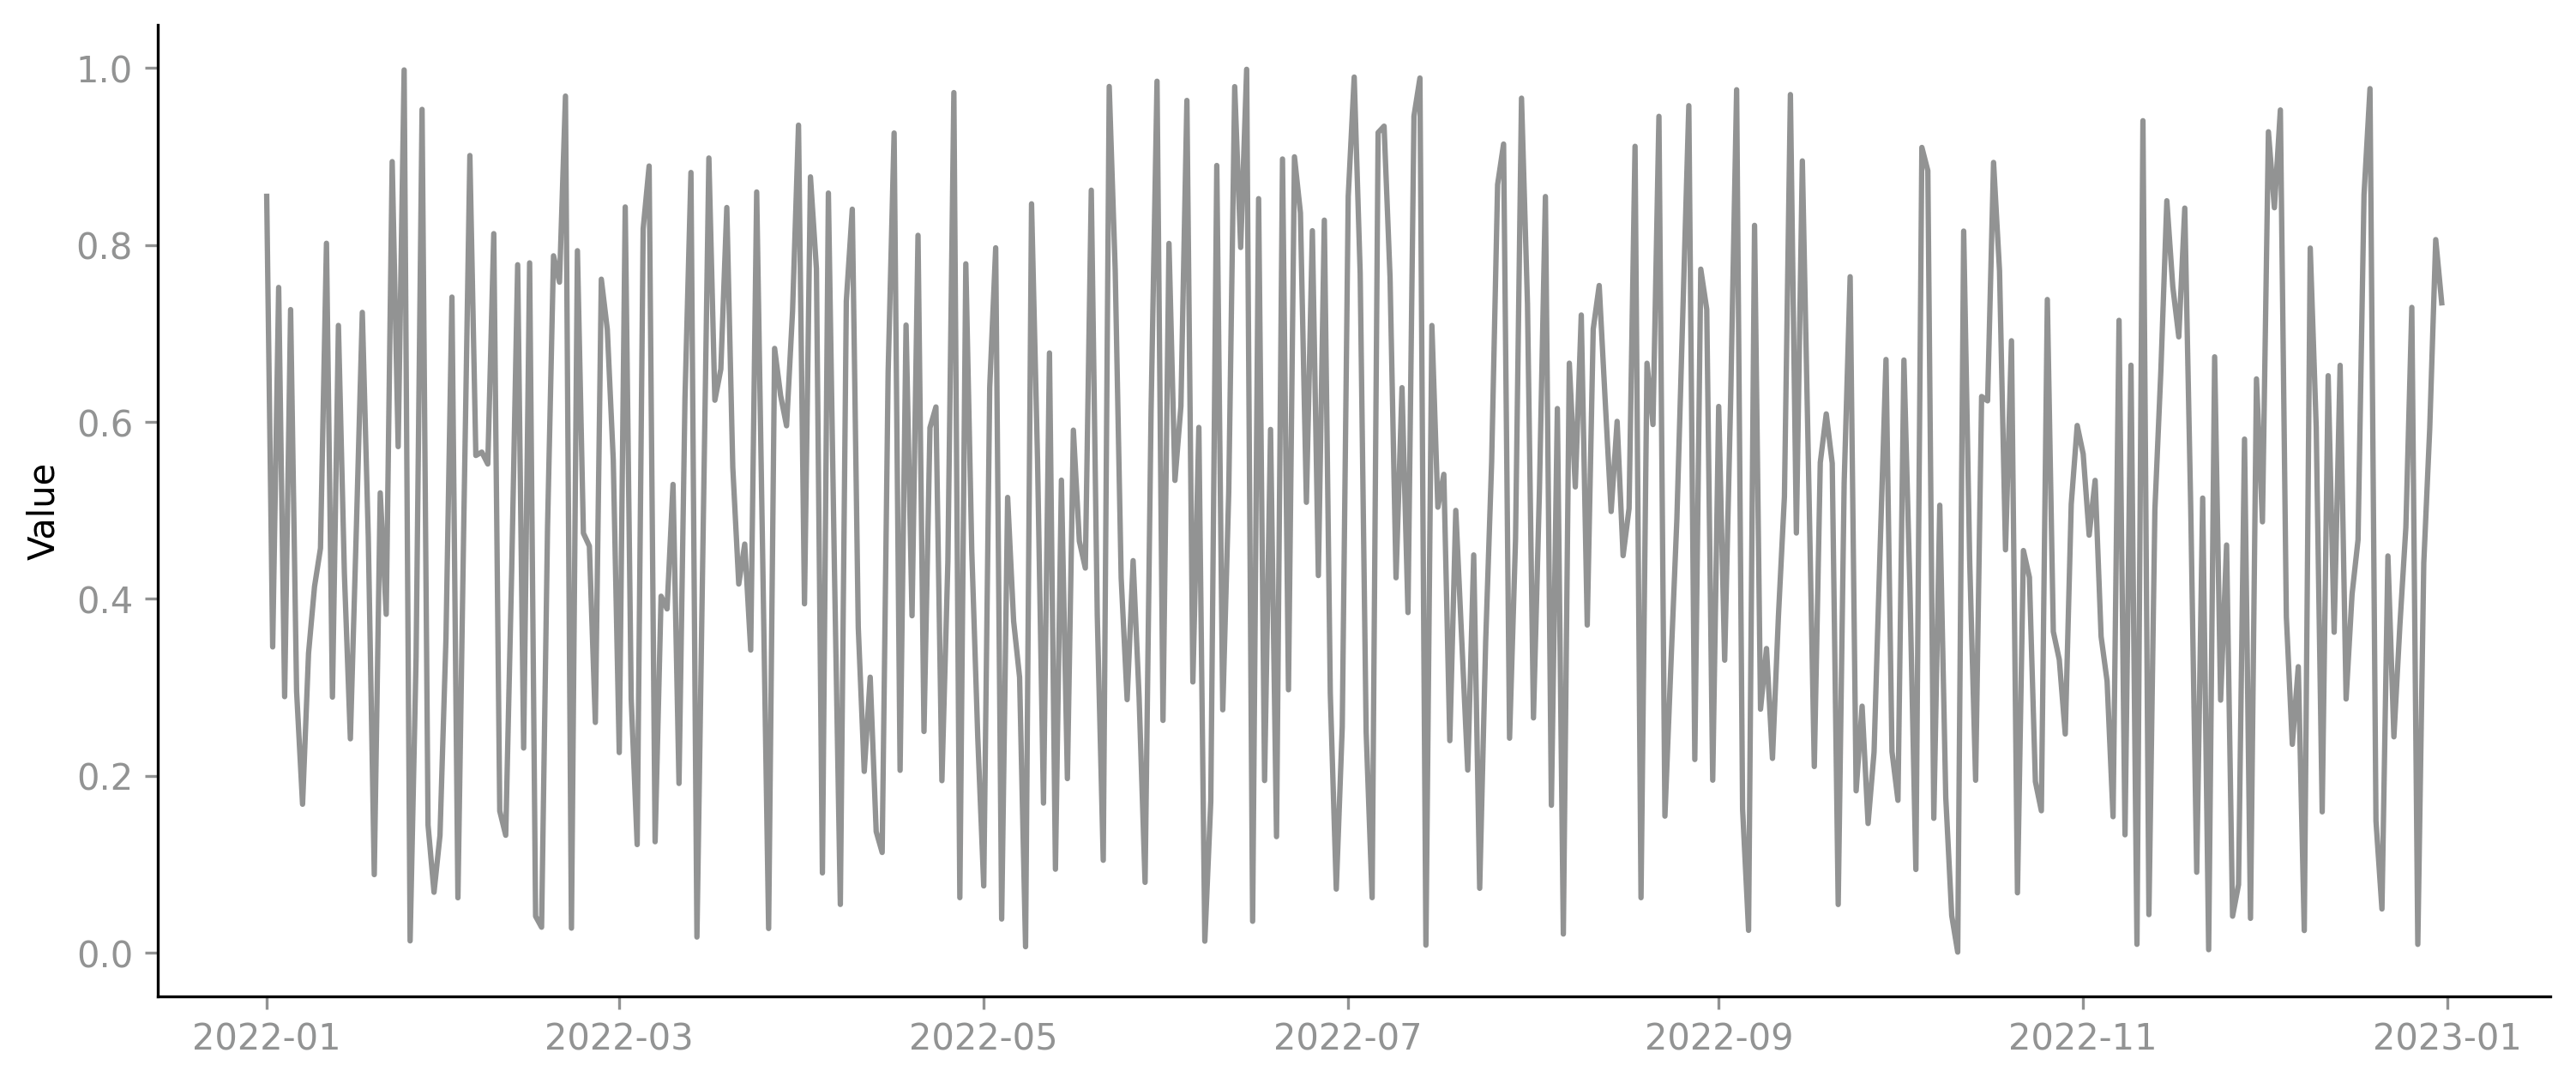
# Re-index
idx = pd.date_range('2022-01-01', '2022-12-31')
df.index = pd.DatetimeIndex(idx)
df = df.reindex(idx, fill_value=0)

g = sns.lineplot(x=df.index, y='Value', data=df, color=default_color)
plt.show()
Modify date format

import matplotlib.dates as md

g = sns.lineplot(x=df.index, y='Value', data=df, color=default_color)
g.xaxis.set_major_formatter(md.DateFormatter('%b, %d'))
plt.show()
Modify tick frequency both Major and Minor

import matplotlib.dates as md

g = sns.lineplot(x=df.index, y='Value', data=df, color=default_color)
g.xaxis.set_major_formatter(md.DateFormatter('%b, %d'))

g.xaxis.set_major_locator(md.MonthLocator(interval=1))
g.xaxis.set_minor_locator(md.DayLocator(interval = 1))
plt.show()