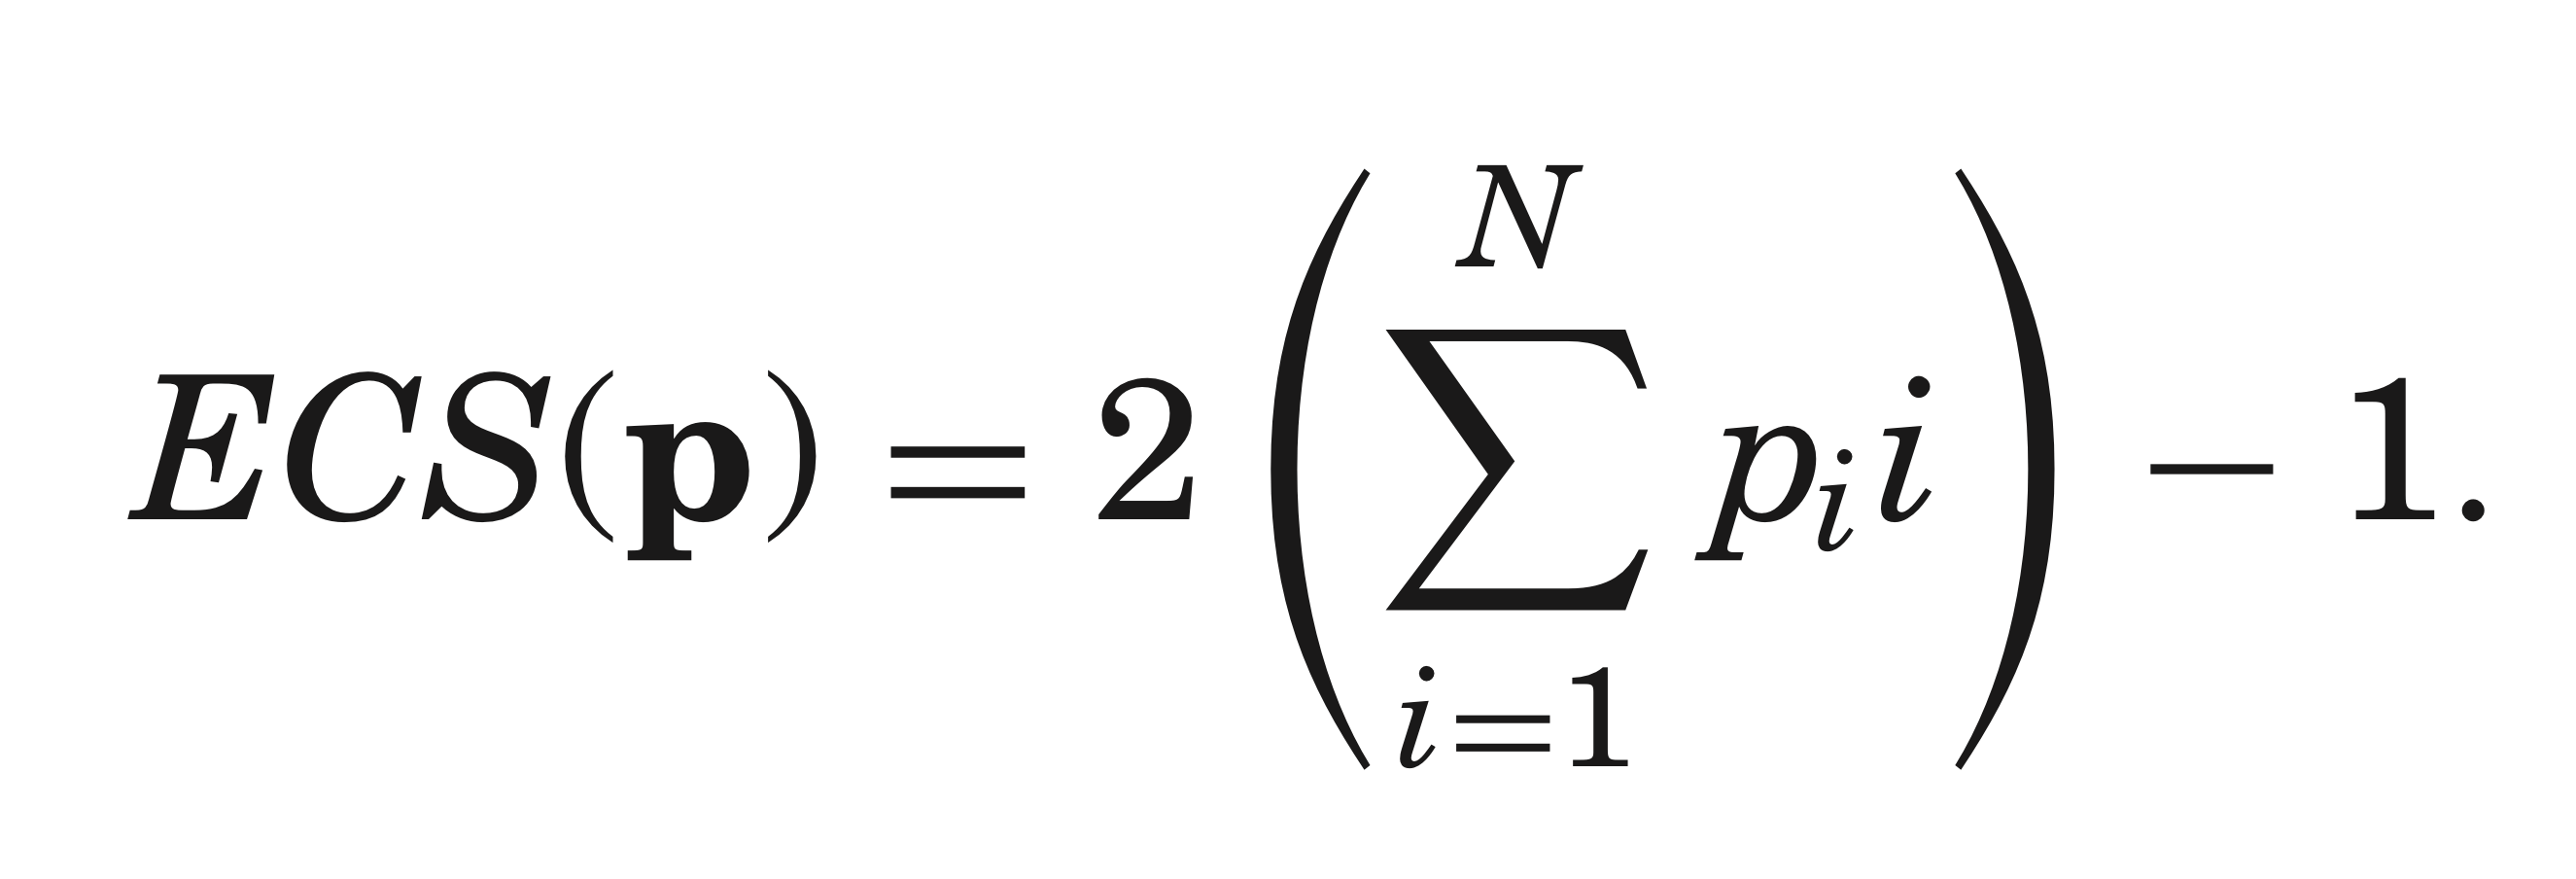
A metric that describes how spread viewing is across the items in our catalog. If most viewing comes from a single item, it will be close to 1. If all items generate the same amount of viewing, it is close to the number of videos in the catalog.

p is the probability mass function corresponding to the share of hours streamed from the popularity-ordered videos in the catalog.
i is the order of popularity-ordered videos in the catalog.
Example 1
If we have 3 videos ordered by most-streamed hours as below.
Video 1: 10 hours Video 2: 6 hours Video 3: 3 hours
Then the total streamed hours is 10+6+3 = 19 hours.
p of 1st video is 10/19 = ~0.526
p of 2nd video is 6/19 = ~0.316
p of 3rd video is 3/19 = ~0.158
so on…
From the ECS function above:
ECS(p) = 2 * ( (10/19 * 1) + (6/19 * 2) + (3/19 * 3)) - 1
ECS(p) = ~2.263
Example from TIVO
Personalized Content Discovery Drives Higher Content Consumption for a Leading Pay-TV Provider
Reference
C. A. Gomez-Uribe and N. Hunt, “The Netflix Recommender System: Algorithms, Business Value, and Innovation,” ACM Trans. Manage. Inf. Syst., vol. 6, no. 4, pp. 1–19, Jan. 2016, doi: 10.1145/2843948.
#recommender-system #metrics